Sign up for Lesson Plans, discounts & more!
A Lesson Plan
The Eight Basic Elements of the Earth
In this lesson plan, students will be introduced to the concept of an
element. They will work with the idea that all the millions of
substances on the earth are various combinations of only 8 elements.
Students will work with the Periodic Table of the Elements and symbols
of the elements. Additionally, students will present their data in the
form of both bar and circle graphs.
Lesson Plan Direct Aims:
- To introduce the names of the eight elements that make up most of the earth’s crust.
- To give an impression of the percentages of these eight elements
- To create different types of graphs to represent the quantities
Lesson Plan Indirect Aims
- To give the students an experience with the Periodic Table of the Elements
- To introduce the chemical symbols of the elements
- Work with percents and decimals
- Work with various types of graphs to represent the quantities
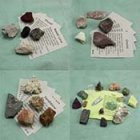
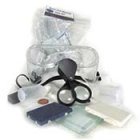
Materials needed for this lesson plan and follow-up work:
- Chart showing the layers of the Earth
- 100 marbles divided into the following colors:
Note: Two options are given for demonstrating the quantities. If you want to demonstrate portions, break marbles into approximate sizes as shown. But you could also round to whole marbles as given in parentheses.
- 46½ red (or 47) – {oxygen-46.4%}
- 4 ¼ white (or 4) – {calcium-4.2%}
- 2 yellow {potassium-2%}
- 2 ½ clear (or 3) – {sodium-2.4%}
- 2 ½ blue (or 3) - {magnesium-2.3%}
- 8¼ silver (or 8) – {aluminum-8.2%}
- 28 ¼ green (or 28) – {silicon-28.2%}
- 5 ¾ black (or 6) – {iron-5.6%}
- (1 marble of another color if using whole marbles for other elements to represent all other minor elements)
- Cards for each of the elements
- A copy of the Periodic Table of the Elements
- Task Cards for Follow-up Work
Lesson Plan
- Hold up the chart of the earth’s layers and review the names of the layers: inner core, outer core, lower mantle, upper mantle, crust/lithosphere, hydrosphere, atmosphere, etc. to fit your chart.
- Review the terminology for the lithosphere vs. hydrosphere. Equate the term lithosphere with crust.
- Show Periodic Table of the Elements.
But even though there are 92 natural elements, only 8 elements make up most of the earth’s crust.
- Show the container of marbles.
Do you see that there are different colors of marbles? The different colors represent the different elements that make up the earth’s crust.
- Have the students separate the marbles into the different colors.
This represents the different amounts of the various elements. The red marbles represent the element Oxygen. Oxygen makes up nearly half of the earth’s crust.
- Show the Oxygen card. (in red, to match) Discuss the number of marbles out of 100. (46¼ or 47) Compare this to the percentage written on the card.
The green marbles represent the element Silicon. Silicon makes up more than ¼ of the ingredients of the crust.
- Show the Silicon card (in green, to match) Again, discuss the number of marbles out of 100 (28 ¼ or 28) and compare to the percentage on the card.
- Students should be able to match these, if only by color. Check by counting and comparing the percentages.
- Once the materials are matched, continue with the lesson plan by showing the blank circle graph. (or give a blank graph to each student)
Which section do you think represents Oxygen? (the largest section) This section can be colored red to match the red marbles that represent Oxygen.
- Point out the Key in the bottom corner of the graph page. Review the parts of the Key and its purpose as follows:
Do you think you could match the sections of the graph to the different quantities? What color do you think this section should be?
- Point to the next largest section. (This represents silicon so should be colored green.) Continue to support the students to match the sections and color in both the graph and the key.
- Note:At this point in the lesson plan you could move away from the students as they finish this work independently. Before you move away, help the students brainstorm an appropriate title for the graph and introduce the follow-up task cards.
More Lesson Plans

INTERESTED IN MORE? IF SO, YOU MAY WANT TO CHECK OUT OUR OTHER SITES:
fossilicious.com - Our online fossil and mineral rock shop.
fossils-facts-and-finds.com - An educational site about fossils.